Label: Resolution HD Camera
This article refers to the address: http://
At present, megapixel high-definition cameras are increasingly used for monitoring, with 1 megapixel camera, 2 megapixel camera, and 5 megapixel camera. The pixel height of the camera is an aspect of clear image. On the other hand, the high-pixel sensor is also equipped with a high-resolution lens to enable the high-definition camera.
Lens resolution
The resolution of the lens is the logarithm of the black and white lines that can be resolved within 1 mm of the image plane, in units of "pairs/mm" (lp/mm, line-pairs/mm).
The test line pair of black and white equal width is not infinitely distinguishable. When the test line density of black and white is not high, the black and white lines at the imaging plane are very clear. When the density of the black and white test lines increases, the black and white lines can still be distinguished at the imaging plane, but the white lines are not so white, the black lines are not so dark, and the contrast of the white lines and black lines is reduced. When the density of black and white test lines increases to a certain degree, the contrast of black and white lines at the imaging plane is very small, and the black and white lines become gray intermediate colors, which is the limit of lens resolution. See Figure 1.
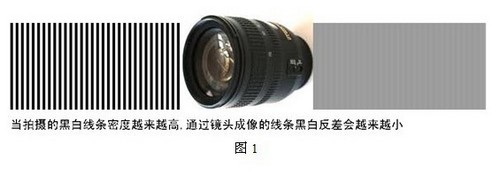
Black and white equal width test line
The resolution of a good lens and a poor lens is very different. One way to test the resolution of a lens is to mount the lens to be tested on a film camera. Take a black and white fringe pattern (resolution plate), and then use a high magnification magnifier (lens resolution detector) to detect the number of lines that can be clearly resolved in the range of millimeters on the film. The more the resolution can be resolved, the higher the resolution. According to China's camera detection standard (JB745-65), the lens center of the general 135 camera has a field of view of 37 lines/mm and an edge field of view of 22 lines/mm, even a first-class lens.
Determining the resolution by a number of lines is one method, and a more objective method is to measure the MTF function of the lens.
MTF (modulation transfer function)
In order to reflect the contrast and resolution of the lens
The measured black and white fringe pattern (resolution plate) is the difference between the brightest part of the white line and the darkest part of the black line, reflecting the contrast (or contrast) of the measured picture. Let the maximum brightness of the white line be Imax and the minimum brightness of the black line be Imin. We use Modulation to indicate the contrast. The modulation degree M is defined as follows:
M=(Imax-Imin)/(Imax+Imin)
The difference between the brightest part of the white line of the graphic imaged by the lens and the darkest part of the black line reflects the contrast (contrast) of the imaged image. Let the maximum brightness of the white line be I*max, the minimum brightness of the black line be I*min, and the modulation degree M* be as follows:
M*=(I*max-I*min)/(I*max+I*min)
If the modulation degree M of the original image and the modulation degree M* after imaging through the lens, then the MTF value is:
MTF=M*/M
Of course, we hope that the modulation degree M of the original image and the modulation degree M* after imaging through the lens can be "original" M*=M or MTF=1. At this time, the contrast (contrast) of the image after the lens is the same as the original image, but the actual situation is that the M* imaged by the lens is smaller than the M of the original image. When the measured black and white fringe pattern density is not high, M* and M are almost equal. As the density of the black and white fringe pattern is gradually increased, I*max and I*min will gradually approach, and M* will gradually become smaller until it is 0, and the MTF will also gradually become smaller until it is 0.
When we change the density of the black and white fringe pattern of the test image, the stripe density of the resulting image is also represented by the resolution or the line per mm (lp/mm).
Using the lp/mm value as the abscissa, the lens MTF value is plotted as the ordinate, and we get the MTF-lp/mm diagram, see Figure 2.
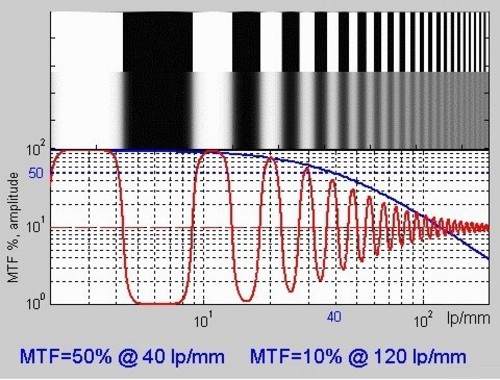
figure 2
In Figure 2, the top is a set of gradually black and white test lines, in the middle is a set of lines imaged by the lens. The red curve in the figure below is the brightness curve of the image formed by the lens. The blue curve is MTF-lp/ Mm curve. When the black and white lines are very thick (the resolution is very low <10 lp/mm), the test picture and the black and white lines of the image are the same, they are all black or very white, and the red curve is the upper and lower amplitude of the curve. The MTF-lp/mm curves are close to 100%. When the test line becomes dense, the white line imaged by the lens will become darker, and the black line will not be black. Looking at 40 lp/mm, the red line representing the black and white brightness becomes smaller, that is, the contrast becomes smaller (I*max-I*) Min), the modulation degree M* becomes smaller, so the blue MTF value drops to 50%. Further increase the black and white test line density, the 200 lp/mm at the end of the picture above represents the red line of black and white brightness becomes very small, tending to the middle value of black and white, the black and white line of imaging is very unclear and the middle gray, blue The color curve has an MTF of 3%, which is the resolution limit of this lens.
The human eye can detect the contrast of 5% of fashion, and it is impossible to detect when the contrast is less than 2%. Therefore, the lp/mm value when the MTF value is 3% is generally selected as the visual resolution of the lens.
In the above figure, there is a horizontal red dotted line MTF=10% and the resolution of the intersection of the blue lines is about 120 lp/mm.
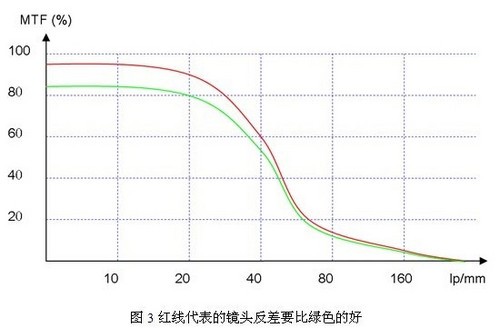
The MTF value at lower resolutions (eg 10 lp/mm) reflects the lens's transparency, contrast, and contrast. A good lens can reach more than 95%, as shown in the red curve of the MTF chart in Figure 3 and the example in Figure 4. If the MTF is small at a resolution of 10 lp/mm, the lens represented by the green curve of the MTF diagram in Figure 3, MTF=84% at 10 lp/mm, its light transmittance and contrast contrast will be Poor, see Figure 5 for an example. The red lens represents the lens and the green curve represents the lens. Although the final resolution is similar, the red curve represents the lens with better light transmission, contrast, and contrast than the lens represented by the green curve.
The left side is Figure 4 and the right side is Figure 5.
When the resolution is 10 lp/mm, the MTF value reflects the light transmittance of the lens is good, the lens contrast is large, and the contrast is large.
When the resolution is 10 lp/mm, the MTF value is small, the light transmittance of the lens is poor, the lens contrast is small, and the contrast is small.
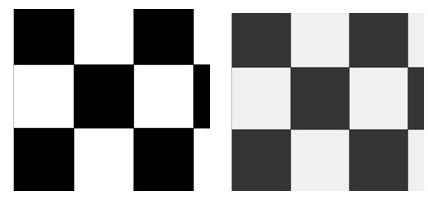
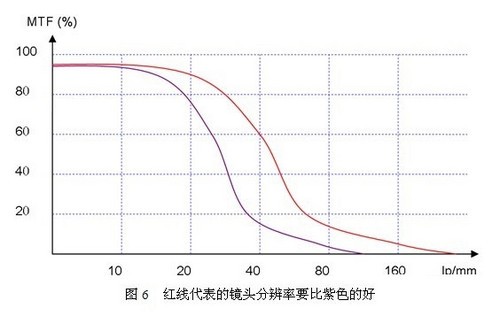
At higher resolutions, such as 30 lp/mm, the MTF value reflects the resolution of the lens. A good lens is above 70%, while a normal lens is below 40%. The lens represented by the red line in Figure 6 has MTF=80% at 30 lp/mm, 1000 lines can be seen on the HD camera, as shown in Figure 7, and the lens represented by the purple line in Figure 6 is at 30 lp/mm. MTF=48%, only 500 lines can be seen on HD cameras, see Figure 8:
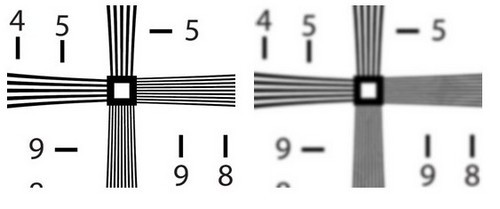
The left side is Figure 7 and the right side is Figure 8.
At 30 lp/mm, the resolution of the MTF is high, and the resolution of the lens is high. See that the test card can reach 1000 lines.
At 30 lp/mm, the resolution of the MTF is low, and the resolution of the lens is low. See that the test card can only reach 500 lines.
Common MTF map
The above MTF plot is a plot of the MTF value at the center of the lens as a function of resolution lp/mm. But MTF is also related to many factors. The aperture of the lens during the test, the distance from the center of the test point.
In addition, the test black and white lines are parallel to the radial line (sagittal direction), or the vertical radial line, that is, the tangential direction (meridional general mark M in the meridional direction), and the MTF values ​​are different.
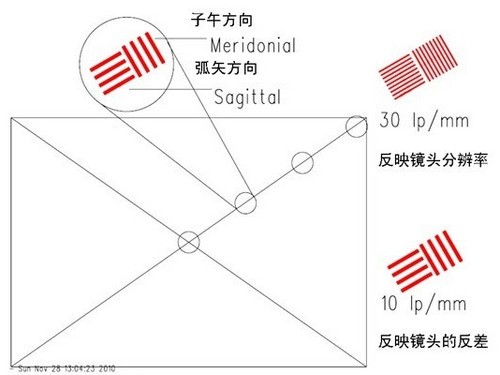
The MTF is different from the center of the lens. The test stripe is parallel or perpendicular to the MTF.
The lens company often uses a fixed aperture, using a black-and-white line with a resolution of 10 lp/mm, to test the MTF value at different distances from the center of the lens to represent the contrast characteristics of the other points outside the center of the lens. Of course, the MTF value will be tested at 30 lp/mm at different distances from the center of the lens to indicate the resolution characteristics of the other points outside the center of the lens.
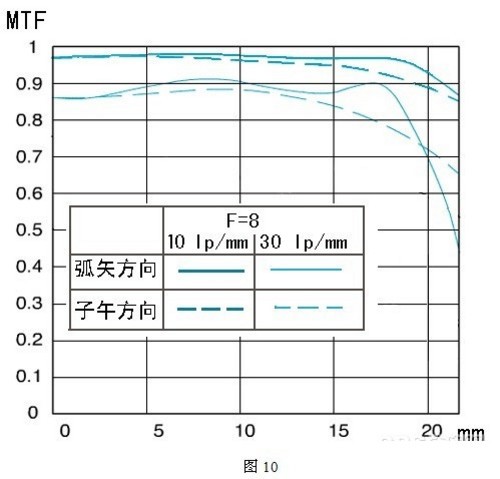
This MTF map is generally measured when F = 8 (aperture value is 8) (MTF is generally best at F = 8). There are two sets of curves, one set is 10 lp/mm with thick lines and the other set is 30 lp/mm with thin lines. There are two curves in each group. The MTF curve measured in the sagittal direction (the test black and white lines are parallel to the radial line) is generally indicated by the solid line, and the MTF curve measured in the meridional direction (testing the black and white lines perpendicular to the radial line) is generally used. The dotted line indicates a total of 4 curves.
Figure 10 is an MTF diagram of a lens at a different distance (mm) from the center. As can be seen from the lines in the figure, the blue thick line representing the contrast (10 lp/mm) is very high, close to 0.97, indicating that the lens has a very good contrast at the best aperture of the F8. The blue thin line representing the resolution (30 lp/mm) is also above 0.86, indicating that the resolution under this aperture is also excellent. The blue curve is still straight until it is about 18 mm from the center, and only slightly drops at the edge, indicating that the lens has consistent characteristics throughout the imaging range, and the corner resolution is slightly reduced. The solid line is close to the dotted line, reflecting that the lens astigmatism is also small. The interpretation of the MTF map can be summarized as follows:
The low frequency curve of 1, 10 lp/mm reflects the contrast characteristic of the lens. The higher the curve, the larger the contrast of the lens.
2. The high frequency curve of 30 lp/mm reflects the resolution of the lens. The higher the curve, the higher the resolution of the lens.
3. The closer the sagittal curve to the meridian curve are, the smaller the distance is, which means that the lens astigmatism is smaller.
4. The flatter the MTF curve, the better. The more straight, the better the consistency between the edge and the middle.
HD camera lens selection
High-definition cameras have more than a million pixels, but it is necessary to fully match the high-definition camera's megapixel performance with a high-definition lens that matches it. So how do you choose a high-definition lens?
We know that a lens has its highest resolution N lp/mm, so according to the Nyquist sampling theorem, at least 2N/mm spatial sampling points are needed. This can be understood as follows: there are N black and white line pairs in 1mm, then there are N white lines and N black lines totaling 2N lines. A photoreceptor of the camera corresponds to a white line or a black line, then the camera needs 2N photosensitive elements in 1mm to correspond to N white lines and N black lines, and the photosensitive element density of the camera is 2N/mm, see figure eleven.
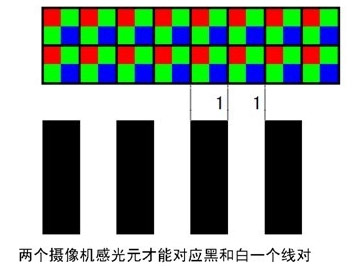
At this time, the resolution of the camera's photosensitive element and the resolution of the lens match exactly, and no one is wasted. Similarly, if the pixel density per millimeter of a camera is M dots (pixel/mm), then a lens with a resolution of M/2 lp/mm should be selected. Let's take an example:
There is a 2 megapixel camera with 1600 x 1200 = 1920,000 pixels and a 1/2 inch photo size. We know that the 1/2 inch photosensitive surface has a horizontal size of 6.4 mm and a vertical size of 4.8 mm. Its horizontal pixel density is 1600/6.4=250 pixels/mm, and the vertical pixel density is 1200/4.8=250 pixel/mm. The photosensitive pixel size is 4 um x 4 um. The horizontal pixel density is the same as the vertical pixel density, and the pixels are square. If the pixel is not square, the lens resolution should be as high as the pixel density. Here both the horizontal pixel density and the vertical pixel density are 250 pixel/mm, so the lens resolution should be 125 lp/mm.
If the size of a 2 megapixel camera is 1/3 inch, the 1/3 inch photosensitive surface has a horizontal size of 4.8 mm and a vertical size of 3.6 mm. Its horizontal pixel density is 1600/4.8 = 333.3 pixels/mm. The vertical pixel density is 1200/3.6=333.3 pixels/mm, so the lens resolution should be 167 lp/mm.
From the above example we also see that a 2 megapixel lens labeled 1/2 ä¸ is not suitable for a 1/3 å‹ 2 megapixel photosensitive surface, which is different and important. The 1/2-inch 2 megapixel lens resolution is 125 lp/mm, which is used for 1/3-inch 4.8mm × 3.6mm photographic image surface, 125 × 4.8 = 600 line pairs in the horizontal direction, corresponding to 1200 The pixel has a 125×3.6=450 line pair in the vertical direction, corresponding to 900 pixels. 1200 × 900 = 1080000 is almost one hundred thousand pixels. All 2 megapixel lenses labeled 1/2 用于 can only be used for a megapixel photosensitive surface when used on a 1/3 inch photosensitive surface, or only as a 1 megapixel lens. Therefore, the megapixel lens is not suitable for the size of the photosensitive element. The description of the lens resolution is still relatively accurate.
Sometimes the camera's index will give the size of the photosensitive pixel L (mm), then the black and white line width of the corresponding lens resolution should be L (mm), so the width of a pair of black and white lines is 2L ( Mm), then its reciprocal 1/(2L) (lp/mm) is the resolution of the lens. For example, if a camera indicates that the size of the photosensitive element is 4um, then the limit resolution line width (white line or black line) of the selected lens should also be 4um, and the width of a pair of black lines and white lines should be 2×0.004 mm. The rate is 1/(2 x 0.004) = 125 lp/mm.
UGR LED Downlight,LED Recessed Downlight,UGR Adjust LED Downlight,UGR LED Commercial Downlight
SHENZHEN KEHEI LIGHTING TECHNOLOGY CO.LTD , https://www.keheiled.com